Oh and Happy New Year y’all.
Looking back through my 2014 timeline there were a bunch of images that nicely illustrate 10 rules for not for profit Infographics on Twitter.
Including images with Twitter posts dramatically increases both the effectiveness of the communication and the sharing potential of the post. That means you reach more people with a more memorable message. Not exactly rocket science, but what makes an effective infographic for social media sharing?
The more I looked at the graphics out there it seemed to me that getting it right isn’t so much about learning new rules than it is about remembering some old ones.
You Can’t Control Sharing, Remember the Brand
When an image is shared it is beyond your control. It can appear in any context, anywhere, anytime on anyone’s feed. In fact that’s exactly what you want but you DO want people to know where the image came from – and maybe even what they can do next. So spot the deliberate mistake:
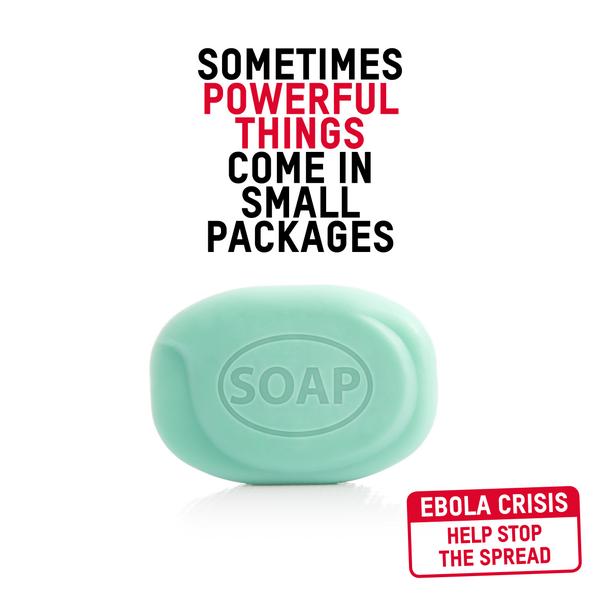
This simple image makes a simple point well – strong simple image andunambiguous wording. great, but what now and with who? If you want people to know who you are you might want to brand your image and if you want them to take action you might just want a web address or a hashtag.
Here’s another – it even caused a fuss in the media:
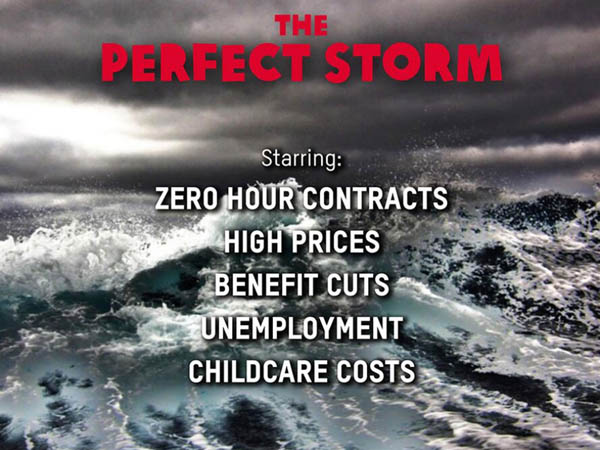
An easy mistake to make if you are an inexperienced organisation. As it is this was from Oxfam – not that you would know it; detached from their feed it might as well be from another planet!
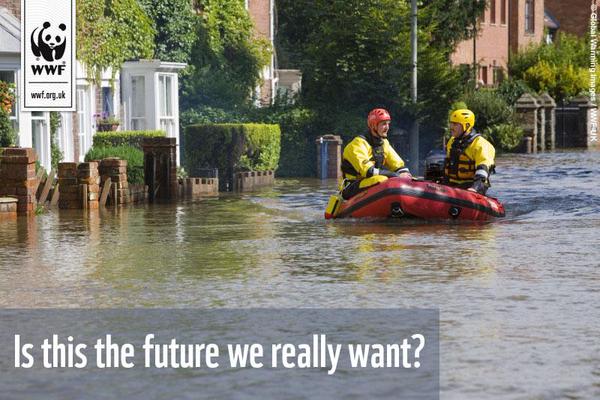
Also based on the essential and most powerful advertising formula – this image from WWF UK, who don’t forget to use their powerful brand and web address.
Name Sources for Credible Information
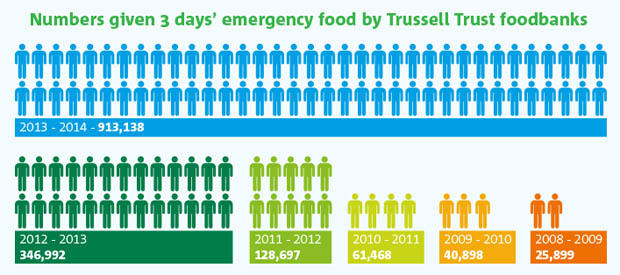
Awareness of message and facts about the issues being championed are often just as important as brand awareness. This is one of my favourite images of last year (and I make no apology for mentioning it again). Simply presented, colourful and powerful, the information speaks for itself. It states its source and the facts from Trussell Trust, operators of Food Banks across the UK, tell the story.
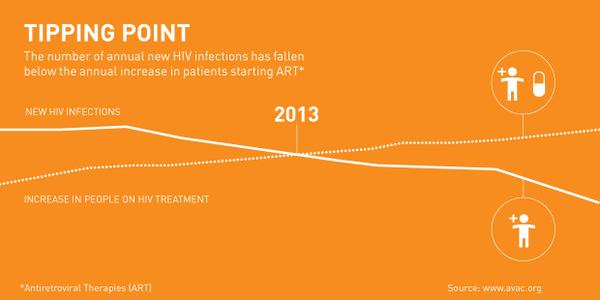
When I saw this infographic on World Aids Day I found the message encouraging – donors want to see the results of their work and when there is good news it needs to be told. The Bill and Melinda Gates Foundationpushed out this good news image with credible data, though once again, it’s unbranded. Disappointing but worse is the monotone presentation of data that could be so much stronger and almost unreadable type – a great story somewhat lost.
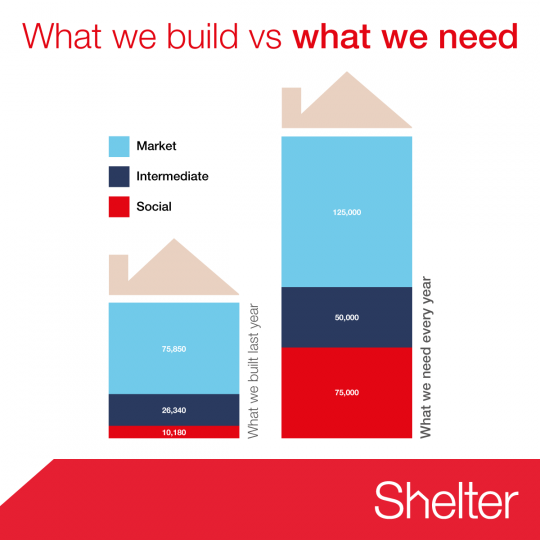
Shelter, the housing homelessness campaigning charity, get it right with this simple image to make their point that UK housing starts run woefully behind the need for homes.
Keep it Simple, Keep it Clear
Twitter is an instant medium so impactful images are best. Also, images work best when their size is optimised to what works best for the medium. Twitter, for example, previews in the timeline at 435×375, Instagram images are square, Facebook – well, it depends on the latest redesign. There are so many networks and they change from device to device that it is hard to keep track of them all. Anyway, the image will be shared on different networks whatever you do – remember you are NOT in control.
All that said there are several good practice points to remember:
- Make your point simply – less is more
- Remember there is a limit to what readers can cope with – don’t try to tell the whole story
- Think carefully about how people read and where their eyes will go
- Challenge yourself – do you need every element – if in doubt, take it out.
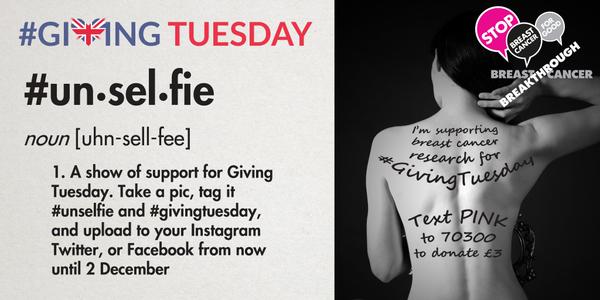
Breakthrough Breast Cancer do great work and their visual campaigns have involved people. There’s a bit too much going on here, but all the essential elements are present.
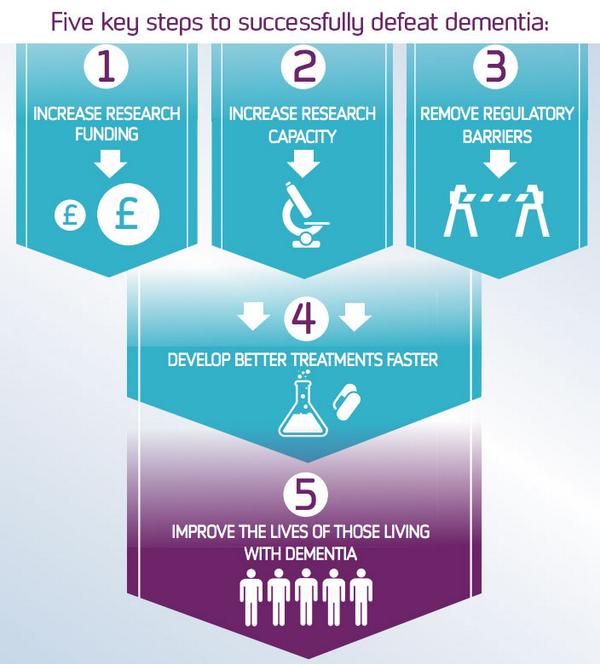
By contrast, Alzheimer’s Research UK explain their mission with this concise image – the only problem is who’s mission are we talking about?
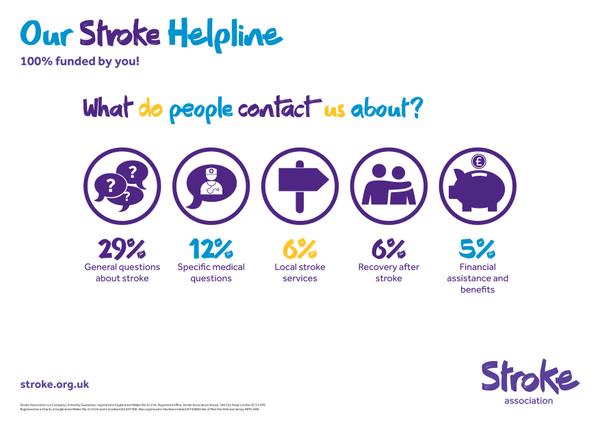
The Stroke Association are almost there with their series of infographics promoting the work of their helpline, and they and aren’t afraid of white space. In fact they get everything right except the use of three colours in a headline which weakens the message.
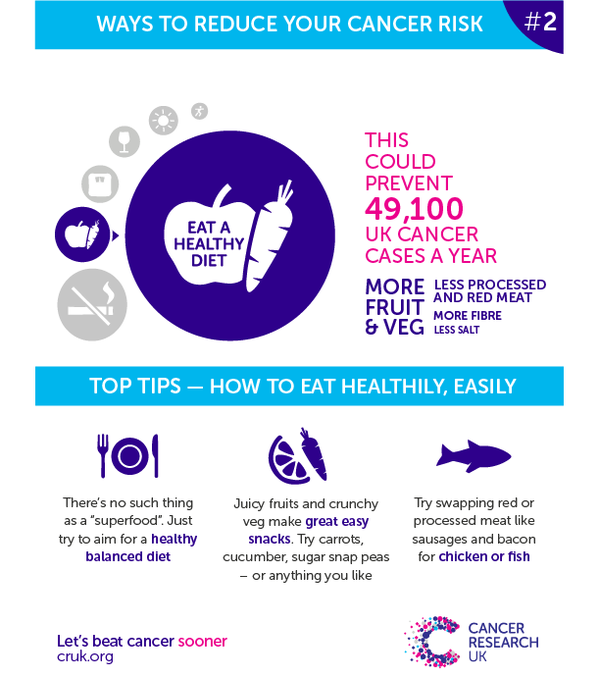
Cancer Research UK almost nail it – it’s a series, it’s simple, it’s informative but they don’t seem to get hashtags! A series of images in a common style is an important way of amplifying your message and increasing recognition.
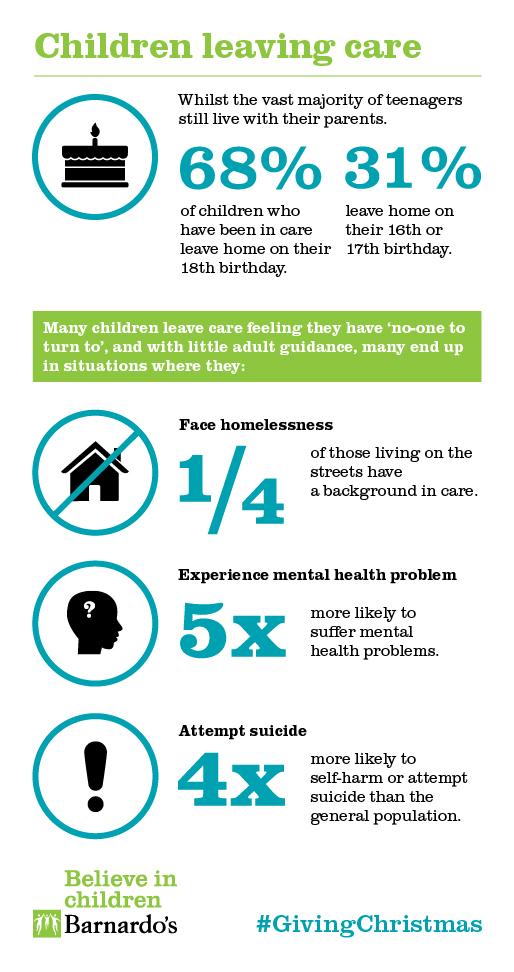
Finally, larger graphic can work on social media so long as there are well designed. Here Barnardo’s get it spot on explaining the facts about children leaving care.
Best Practice with Not for Profit Social Media Infographics
To sum up the 10 rules for not for profit Infographics on Twitter:
- Brand your images for sharing: whether for blogs or social media
- Include a call to action and somewhere to go next
- Hashtags – include them
- Less is more – don’t try to say too much
- Think carefully about the size of the image
- Use colour carefully and keep it on brand
- Make your facts credible by including a source
- Make sure your type readable in at 600 pixels square
- Strengthen your point with a series of infographics
- Remember how people read – keep it logical